Chapter 3 Workflow
Traditionally, there is a clear separation of roles between database administrators, data engineers, data analysts, data scientists, and policy analysts. You can see that distinction in the following diagram:

Roles Diagram
Database administrators and data engineers are usually responsible for Data Collection and Storage. They ensure that the end-user (data analyst, policy analyst, researcher, or scientist) can consistently access the data with no problems (step 1 of the diagram). Data analysts are responsible for pulling the data, cleaning, organizing, analyzing, visualizing, and presenting findings (steps 2 and 3 of the diagram). Today, data scientists should be able to do steps 2 through 4 of the diagram. However, it should be understood that the primary responsibility of a data scientist is predicting future trends (step 4). Policy analysts are not on the diagram, but they are the idea generators and theoretically should be able to do steps 3 and 4 to some degree.
Now, look at the diagram again. The selected area is where the Data Analytics & Engineering team operates. I expect us to be able to cover every step on this diagram.
- We are not database admins, but we do have ‘write’ privileges for our database servers (step 1).
- Our primary concentration is data preparation. We should be able to solve a data-related task of any complexity (step 2).
- We should be able to build interactive and dynamic visualizations of various types, including static and dynamic applications with front and back end. We must present our findings in a high level and coherent format understandable and useful to the audience (usually, our leadership) (step 3).
- Although we are not required to predict anything, we should and do have that capacity. We should be able to come up with new ideas and, most importantly, realize them in a form of scripts, prototypes, and pipelines (step 4).
3.1 Establishing a Data Science Environment
Each analyst operates in their own way; however, the following setups should be followed to leverage collaboration across the team:
Install R, Rstudio & adjacent tools
R Base
Rstudio
Install Python 3.xxx
Anaconda
Set proxies
SQL Server Management Studio
ArcGIS or QGIS (if needed)
Git
NPM
3.2 Professional Development
Each analyst has tools available to them for improving their data skillset:
DataCamp
- TLC maintains a subscription to the datacamp for R, Python and more; for membership access speak to your supervisor
FreeCodeCamp
- An excellent free course for learning html, css and javascript
StackOverflow
- Is your friend if you are stuck
YouTube
- Most things you can learn there
R, Not the best practices
- 90% of the R code related stuff that you will be doing at TLC is covered there
3.3 Metrics, Analytics & Automation
Important: Moving forward we will focus on automating our work as best as possible. We already do for the most part. The general process:
Create a script -> Output a result -> Automate the script to run on schedule -> document (the what, the how, the when, and the why)
Note: Automation is a judgment call and should be considered the default. Note that in the documentation if things are ad hoc or too custom to automate. The rule of thumb is: automate when there is a temporal element since this generally means someone will ask for this again.
All final reports and analyses should go under the directory below unless otherwise directed:
I:/COF/COF/DA&E/your_name…
This folder holds other subdirectories with various output files like images, excel documents, and other relevant data. The general structure analysts on the analytics team should follow are:
Unless otherwise directed, create a folder in your folder and label it with topic words of the project you are working on
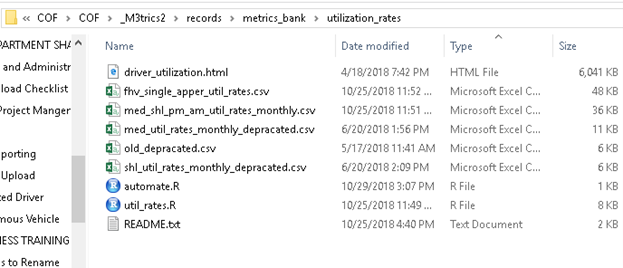
In that root folder, insert your main script, cache any data files in subdirectories, and provide a documentation file. Below is an example:

Folder Example
Note that in the folder, we have output files, the main script, and an HTML report meant to help present the work. The automate script leverages the taskcheduleR package in R to make the script run every month; this way, utilization rates for medallions and shls are updated automatically.
3.4 Dashboards & Apps
Currently, we are working on standardizing our analyses as best as possible to allow for quick servicing of both routine and some ad-hoc requests. As tools become more streamlined, we will be able to expand with internal dashboarding tools; currently, limitation in licensing tools and opensource software acceptance has hindered our ability to use these. Tools which we now use for dashboarding are:
Dashboards
Shiny R
PowerBI
Apps
Shiny R
ReactJS
React Native
3.5 Passwords, Usernames, Accounts
This sections has the accounts and passwords common to the whole team.
3.5.1 Gmail
tlcanalytics1971@gmail.com
pwd: xxxaskyoursupervisorxxx
3.5.2 Github
tlc-analytics
usr: tlcanalytics1971@gmail.com
pwd: xxxaskyoursupervisorxxx
3.5.3 shinyio
tlc analytics
usr: tlcanalytics1971@gmail.com
pwd: xxxaskyoursupervisorxxx
This work is licensed under a Creative Commons Attribution 4.0 International License.